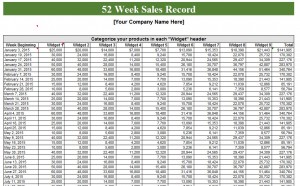
Recognizing trends in your sales and storing all that information is finally made easy! The 52 Week Sales Log is a simple and free document that allows your business or non-profit organization to log all your important sales figures over the next 52 weeks. This template will also include a graph that illustrates which month had high or low sales for your organization!
52 Week Sales Log Instructions
Click on the file below to start downloading it to your computer. Once you have the document you can begin customizing your important sales information.
All the data you need is entered on one convenient tab. You will begin by entering the date you want to start in the left-hand column titled “Week Beginning”.
Then the various “Widget” titles at the top can be changed to different departments or items, depending on how your store operates. Simply click on any information you want to change and start typing over it with your own data.
The template will automatically calculate the totals for each section at the bottom of the screen. This way, you know exactly how well a certain aspect of your business is doing on a given day. All this information will be displayed on the graph below for a nice clear overview.
After you have finished entering in your sales data just click on the “File” tab in the upper-left hand corner of the page and press the “Print” option. You can store the document safely away in your files or keep the template on your computer for convenience.
Why Use the 52 Week Sales Log?
Understanding the ebb and flow of your sales by department or item is a way for you to make great decision and increase those sales in the future. Now you can keep track of all that data to review and have a helpful sheet to analyze the information. No more sifting through file after file for the information you need each week. The Sales Log is ready and waiting for you!
Download: 52 Week Sales Log
Check out this offer while you wait!

