Tracking your blood glucose readings is essential to your diabetic well being. Monitoring and keeping track of your readings can be a hassle at times, but it doesn’t have to be. You can use the Excel Blood Glucose Level Chart featured on this page to monitor your glucose readings daily! The blood glucose level chart from Microsoft is available for instant download and is completely complimentary courtesy of MyExcelTemplates.com.
Using the Excel Blood Glucose Level Chart
The Excel blood glucose level chart is very easy to read, use and understand. The Excel template from Microsoft is split into two separate pages. The first page is titled “Blood Sugar Data” Here is where you will type in all of your important information regarding your glucose levels.
As designed, there are seven days in the chart for you to log your readings. The three categories of the chart are labeled date, time and blood sugar level. Within each day is space for three individual readings.
The first step in using the chart is to input the first date of your first reading and the remaining corresponding days of the week. Next, enter the time that you took your first reading, second reading and third reading. Next to the corresponding time, input what your blood sugar level was. This process will be repeated throughout the day and week.
Because it’s a Microsoft Excel template, the chart is completely customizable. You can add or remove spaces depending upon how you would like to monitor your glucose levels.
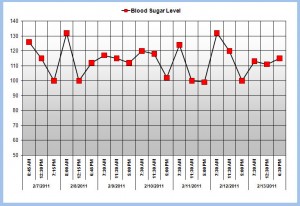
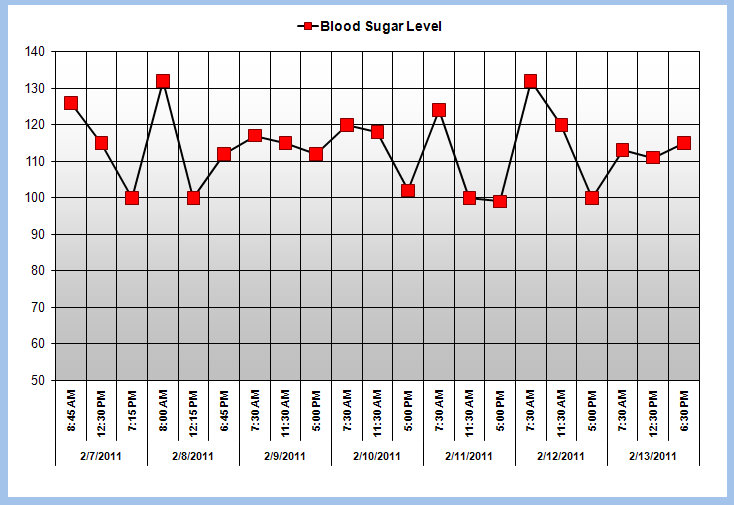
Once the blood sugar levels have been added to the template, you can move on to the second page of the Excel blood glucose level chart. The second page is titled “Blood Sugar Level Chart.” This sheet will reveal a graph of your blood sugar level based on the information placed in the data page. It’s critical to be as accurate as possible when placing information in the data page so you will get an accurate graph. This graph will show your blood sugar levels throughout the day and week.

Download: Excel Blood Glucose Level Chart
Check out this offer while you wait!


What are the glucose ranges for low, high, and normal levels. I understand normal range is 74-106 mg.
Talk to your doctor to find your optimal glucose ranges. Even though they may be close by definition, everyone’s exact number may differ slightly depending on what their doctor dictates…Review this site for more information on glucose ranges: http://www.diabetes.org/living-with-diabetes/treatment-and-care/blood-glucose-control/checking-your-blood-glucose.html
Admin
MyExcelTemplates.com
Hi, can you send me a chart that converts glucose figures into mg dl and vice versa?
Due to our time restraints, that is not possible…
Pingback: How to manage your diabetes « North Shore Institute of Healing