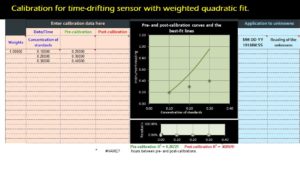
Calibrating your concentrations is simple if you don’t have to account for time-drifting that is variables that change over time. However, sometimes this is not the case and you need to calculate reliable data that takes this time-drifting into account. Using this free template, you can easily measure the drift by first measuring the standards once again after your first measurement. The result will be more accurate data and this template makes this tedious task much more simple, organized, and quick. To try this free template today and learn how to use it, just read the free guide below.
Using the Calibration Drifting Quadratic Weighted Template
First take a look at the structure of the Calibration Drifting Quadratic Weighted Template. You will simply enter your data in the first 4 columns of the template in terms of time. You will then enter your unknown data in the blue columns to the right of the chart. This Calibration Drifting Quadratic Weighted Template will display the transitions of your concentrations over time in the form of a curved chart.
Next, assume that your time-drift is linear, which is safe to assume. The template will take your data that you enter into these 6 columns and use a quadratic fit formula to give you both calculations before and after your data points.
Then, your free template will use linear interpolation to give you an estimation of the calibration curve parameters for each sample that you enter into the chart.
The method has been proven time and again to produce accurate results, as long as the drift is linear. Usually, when people ignore this drift factor the results can be a drastic difference. Even with a minimal amount of calculations done to account for the linear time-drift of your concentrations, you can more accurately calculate your chart the calibrations of your unknown concentrations.
Download: Calibration Drifting Quadratic Weighted Template
Thanks to T. O’Haver for his contribution
Check out this offer while you wait!

