

Pie charts are a truly wonderful invention because they are comprised of two great things: shapes and numbers that all fit together evenly. Pie charts can represent all things in life that are made up of at least two parts. Use this Colorful Pie Chart Template to graph something in the most wonderful aesthetic.
How to use the Colorful Pie Chart Template
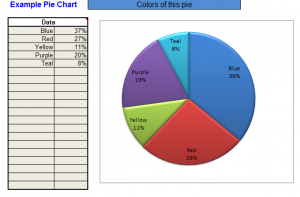
Download the template using the link at the bottom and open it in Excel. The chart is premade with 5 entries, each indicating a color and the percentage of the pie chart that is that color. To use this chart for your own example, start by changing the title from “Colors of this pie” to whatever you are categorizing.
In the Data field, change the colors to your own categories. Leave a field blank if you don’t need it, or add more. The percentage portion will change the size of the graph pieces. Note that you can enter in percentages in the data form, but the pie will automatically adjust that number to reach 100% in total – so if you are unsure of the math, look at what the chart piece changes to. All the pieces on the actual graph will always add up to 100%.
Tips on using the Colorful Pie Chart Template
- Use this chart if you are bad at math. The chart will always add up to 100% so you cannot possibly go wrong.
- Create a pie graph that looks like Pacman by making one field 70% and the other 30%. Have fun with charts.
- Pie graphs can chart almost any data. Keep track of your daily sodium intake, how many Law & Order re-runs you watch each week, or measles outbreaks.
Download the Colorful Pie Chart Template
Check out this offer while you wait!