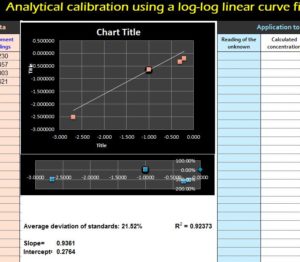
In log-log calibration, the logarithm of the measured signal A (Y-axis) is plotted against the logarithm of concentration C (X-axis) and the calibration data are fit to a linear or quadratic model. This allows you to get more accurate results with a linear curve fit line that charts the most reliable path within your data. The benefits of using this type of template is using the logarithm from your instrument readings of the data and using the anti-log to get at the unknown chemical concentration you need. This template is a great tool for students to take advantage of and use for free. Learn how to use and download this free template today.
Using the Log-log Calibration Linear Curve Template
To download this template to your computer, just follow the link at the bottom of this page.
You will begin by opening the document and entering the standards of your concentrations in the first column of the template. You will then enter the corresponding instrument readings as well. The Log-log Calibration Linear Curve gives you a few examples to work with so you can see how to format your data to work with the template.
You can see how the template will automatically take the results from your data and plot them along the linear curve fit graph.
You should note that any readings of the same value should be entered as different items in the template for more accurate results.
Now, enter the readings for your unknown concentrations in the blue column of the Log-log Calibration Linear Curve to see the calculations to the right. You will immediately be given the calculated concentration, along with the calculated accuracy of your unknown reading and the margin of error.
Using this tool to calculate the logarithm and anti-log, and all steps in-between, you can gauge your unknown calculations to find the most accurate data.
Download: Log-log Calibration Linear Curve
Thanks to T. O’Haver for his contribution
Check out this offer while you wait!

