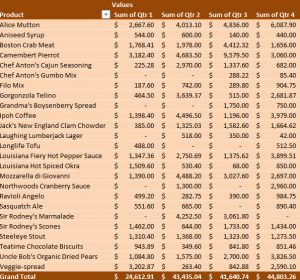
For those in a smaller business, it can be easier to track your quarterly sales through Excel than through a third party. The Sales Report Template is an easy and effective Excel sheet to track purchases from consumers for each quarter.
How to use the Sales Report Template
Using the link below, download the Sales Report Template in Excel. The sheet is pre-populated to help guide you. It is divided into “Product”, “Customer”, and then each quarter of the year. This front page is just the data collection.
Move to the bottom of the page and select the tab that says “By Product”. Here is where the template has automatically calculated the sum totals of each product by quarter, along with their grand totals. The data you enter on the “Source Data” tab will be reflected in this page to show your own totals.
The next bottom tab is “By Product-Customer”. This is where the template shows individual’s accumulated purchases. Click the + next to a product and it will show which customers purchased it each quarter, along with the totals.
The final tab, “By Product-Customer Filtered” is where the template is already set up to show you the top 10 selling products for quarter 1 and beyond.
When you enter your own data on the “Source Data” tab, these pages will automatically update to reflect your own sales report with all of the math and totals finished for you. Simply enter your own data onto the first tab and then the rest will change.
Tips on using the Sales Report Template
- Simply leave a quarter column blank if you only want to track certain time ranges. Anything left blank, the template will not factor in.
- This sales report template is good for bulk orders to other companies. Your final tab (the filtered one) will show who spends the most and on what product, to help you prepare for the next year.
Download the Sales Report Template
Template courtesy of Microsoft
Check out this offer while you wait!

