

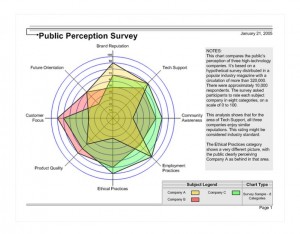
There are different charts used in the Visio program. A chart used often is a Spider Chart. These charts show comparisons of data on a circular diagram. The circle on the chart represents the web and includes a series of rings divided in quarters or eights by straight lines. Each line refers to a measurement and group. Within this ‘web’ are blotch looking patterns stretched out to reach the certain labeled points on the lines representing different measurements. Each blotch is for a certain entity or item and each one is a different color. These are transparent over each other to see the results of each one at the same time.
As Spider Chart is another way of referring to a radar chart and the template is available to download from this site. Instead of taking the time to create a chart from scratch, downloading it will set up a point to build a diagram from. This template is compatible with Visio 2003 and later.
Using The Spider Chart
Using the provided template is easy. Here are some reasons why:
- First, the reason for using this Spider Chart template is simple. It is free to download with no restrictions other than it is only compatibility with Visio.
- Second, it is fully customizable when in use. The template is already set-up with the diagram, images and with the option to change it to your specifications.
- Third, the template is very easy to use. Simply download from this site and import it to Visio or simply launch it and the default program will activate.
- Fourth, the changes made on the chart will also change the information on the status bar in real-time.
Tips For Using The Spider Chart
Once you download the Spider Chart, here are a few things you can do to start using it:
- First, once you download the file change the text to read specifically with your data and measurements. Make sure to save it to prevent from losing these changes.
- Second, change the colors or adjust the chart to fit your needs. You will be able to remove the images or add more and then save the template.
- Third, test your version of the template to make sure that it is complete for the presentation.
There are various types of charts available and this customizable template will help make things a lot easier. This chart is also designed by a quality Visio company. There are no other demands for this free download, all the hard work’s done for you. Make your data matter during your next presentation.
Download: Spider Chart
Check out this offer while you wait!
Thanks