

Every company, big or small, has aspirations of success. How do you measure the success of a business? Usually, by the profit it makes. The 12-Month Profit and Loss Projection Template will help you analyze the value of your business, employees, service, or even just one product by comparing it with the initial cost and sales revenue. It can be difficult to track multiple items at once, but this template makes it easy to enter the information and receive insight into the success or failure of any endeavor you want to undertake. Click the link below to get started on your free template download.
12-Month Profit and Loss Projection Template Guide
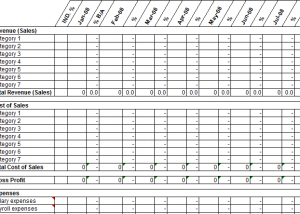
The first step is to go through and change the sections marked “category 1, category 2”, etc. These should actually be labels to specific sales categories or specific products. After you’ve done that, enter the sales for each category for your current month. The spreadsheet will add up total annual sales. In the “%” columns, the spreadsheet will also show the percent of total sales contributed by each category.
Next, you need to decide which of these items have been the most profitable, and which have been the least, and then reflect on why these categories are performing this way. In the “%” columns, the spreadsheet will show the cost of gross sales as a % for that category.
After you have entered the above information, the template will calculate the Gross Profit (total sales minus total cost of gross sales.
Overhead is another major element of any business and is covered in the expenses category. Remember, at any time you can change the pre-written text to items that are more commonly used in your business.
The net profit will be the total amount you have at the end of all your expenses and revenue from your business. The spreadsheet will subtract Total Operating Expenses from Gross Profit to calculate Net Profit. In the “%” columns, it will show Net Profit as a % of Total Sales.
You always want to stay in the know when it comes to your market. The “IND %” column, you can enter the averages for all the businesses in a similar market and size as your own to compare your profits with theirs. This is a handy tool to compare the ending total with other companies.
Stay on top of your company’s profit and loss margins by downloading the 12-Month Profit and Loss Projection Template today.
Download: 12-Month Profit and Loss Projection Template
Check out this offer while you wait!