

In order to successfully run a business one must be aware of what is working, what is not and, most importantly, why. A cause and effect diagram is an easy yet invaluable tool in helping determine where something has gone wrong and how it affects the larger picture. A business includes many parts, from quality control to sales to marketing, and a cause and effect diagram can be helpful across the board.
How to Use the Cause and Effect Diagram Template
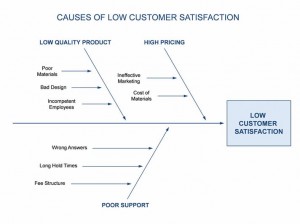
The template is free to download, and can be downloaded straight from this page. It is fully customizable and easy to use, making it useful in various aspects of one’s business. To use the template, take a broad topic (e.g. customer satisfaction), and break it down into the smaller units that comprise it (e.g. pricing, support, and quality). Breaking down a topic, as the cause and effect diagram does, makes it easier to visualize what role each part plays in the broader picture, helping to identify both positive and negative business drivers.
Tips for Using the Cause and Effect Diagram Template
- Start with a broad topic, putting that in the box on the right. Then, divide that topic down into the smaller aspects that affect it, putting those at the top of each arrow (headers).
- Break the headers down into sub-segments. Like a puzzle, looking at a problem piece by piece helps to put the bigger picture together. The more points there are to look at, the easier it is to identify where a problem may be occurring.
- Spot trends. If a sub-segment or header appears across multiple areas of the business, focus on improvements in that area.
- The cause and effect diagram is a versatile tool, so use it to both identify weaknesses and scale strengths. For example, if there is a standout department or aspect of the business, break it down to find out what is working well, and apply that information to help implement change in other areas.
- You can use the template to focus on one area of the business, or create multiple templates across different functions to identify larger trends.
Download: Cause and Effect Diagram Template
Check out this offer while you wait!