

The College Gradebook with Graphs Template is here to help you improve your grades by keeping close track of your academic performance throughout the year. You’ll use this template to start seeing your problem areas and determine where you may start studying to improve. The template shows you graphs that show exactly where you’re at in each subject.
Over the course of 4 semesters, you’ll have an understanding of what subject give you the most trouble and where your time would be better spent.
To get started today, just follow the instructions at the bottom of this page.
Using the College Gradebook with Graphs
You’ll download the free College Gradebook with Graphs template by following the link at the bottom of this page.
Take a look at the information below to better understand how you should start customizing the template for your own use.
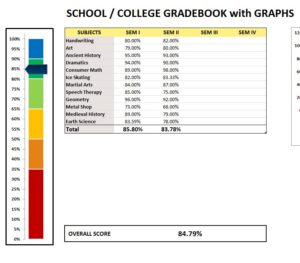
1. This excel sheet shows the graphical representation individually for each semester & also the aggregate score.
2. Add your subjects from the drop-down lists under “subjects.”
3. You can add 24 different subjects
4. Add your score for each subject under the “Semester” columns.
5. You’ll see calculations for each semester & the overall score
6. To the left, the graph shows the overall score bar.
7. To the right, the graph shows the individual scores for each semester.
This template has everything you need to start preparing for your academic future. Start by entering your subjects in the “Subject” tab.
When you finish with that task, go to the “Gradebook” tab and you’ll find your subjects in the first column of the table above.
From there, you’ll enter your different percentages. The template will automatically show you your averages in the colored chart to the left of the main table so you can see where you stand.
Download: College Gradebook with Graphs
Check out this offer while you wait!