

Analyze spending so you can maximize profits for your business or company with the free Cost Data & Chart Template this year. This document makes finances simple and effective, just the way they should be. You will add your company’s expenses in the indicated areas of the document and watch as the template turns that blend data into a perfectly readable chart that you can use to better your business year after year. This template takes out all the nonsense so you won’t be left confused and wondering what the heck you’re looking at, give this template a try and see for yourself why so many people are taking advantage of this free document.
Cost Data & Chart Template Guide
The first thing that you may notice about this template, once you have the document opened, is its only one page. That’s all you really need.
Scroll down to the main table of the document to start entering your various expenses. The first item that you need to enter is the cost center (expense) and the annual cost of that recurring item. The template will then take that information and give you the total percentage of your expenses that the item is taking up and the cumulative percentage as well.
You will see the totals for all the items you enter in this field at the very bottom of the Cost Data & Chart Template. If you need to add more spaces, just press the tab button with your mouse in the last cell in the bottom right corner.
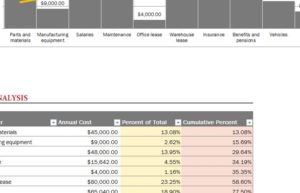
Now, go back to the top of the page to see this information displayed in your bar and line graph above.
The yellow line of the graph shows the trend in your spending and the bars represent the different expenses. As your expenses increase, you will see the line adjust accordingly. Using this template you can see how some expenses will need to be changed in order to increase profit margins in the future of your business.
Download: Cost Data & Chart
Check out this offer while you wait!