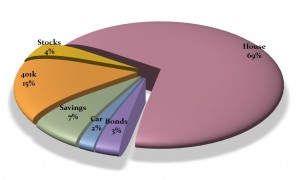
Whether you are filing a report to your bosses, looking to take control of your personal finances, or compiling a graph to add to your thesis/final report for college, pie charts can be a very useful tool. Not only are they pleasant to look at, but pie charts give out information in an efficient and straight forward manner. Instead of listing the percentages in a table, simply create a pie chart and let everyone draw their own conclusions. For this reason, downloading the Excel Pie Chart Generator is a must.
How to Use the Pie Chart Generator
After you have downloaded this Pie Chart Generator from this page, you can begin to use it to its full potential. It may be a good idea to save the file you download under a default name, so you can go back to it if you mess up at any time. Rename the second file differently, and begin editing your pie chart on it.
This Pie Chart Generator is very easy to use, and only a few steps will see you create your own pie charts. Begin using the Pie Chart Generator by labeling the different sections you want to use. For example, if you are doing a pie chart for your assets, add sections for House, Car, Bonds, Savings, 401k and Stocks. Enter in the percentages, or numerical amounts, for each section, and allow the Pie Chart Generator to do its work. You should end up with a Pie Chart that shows all of the sections in a precise manner.
Pie Charts Make Everything Easier
Pie Charts are a great way to get your message across better, especially if you are delivering a presentation. If you are speaking to a group of people, they are going to be concentrating on what you are saying. The last thing you want is to have them read complex data on a table while you are talking. Every projection or piece of data from the past year should be highlighted in graph format. Adding a pie chart is the best solution. With this pie chart chart generator, you will be able to create pie charts in a matter of minutes.
Download: Pie Chart Generator
Check out this offer while you wait!

