

Buying and selling stock is an exciting world but it can be hard to keep track of all that information. When you buy stock you have to consider its growth rate, potential output, present value, and many other things. This can get pretty complicated if you also want to monitor a few different stocks at the same time. The best way to store all this information is by using the Stock Return Value Estimator template. This handy document allows you to keep track of all this important data so you can review and analyze its worth.
Stock Return Value Estimator Guide
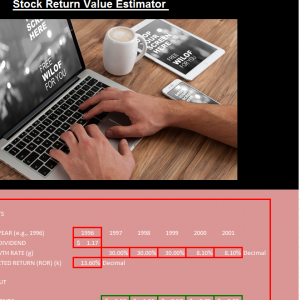
You’ll start by titling your document with the name of your investment. This way, if you want to track a few different stocks, you can just copy the template and make a new tab to edit.
The Value Estimator lets you enter the last five years of a stock’s information. From there, you will continue to make your way through the sections, entering the last dividend, growth rate, expected ROR of that stock.
The template will take the above data that you entered and give you a detailed line graph. The graph will display how well your stock has been performing and its rate of return.
To the left of the graph, the template provides you with a list of all your past percentages based off of your stock’s initial price, so you can clearly see what direction that stock is heading.
Now, you will use this data to make informed decisions about your stock portfolio. You can even track stock you haven’t purchased yet to see if it would be a good investment for the future.
Reasons to Use the Stock Return Value Estimator
- Reusable
- Everything you need is on one page
- Can track multiple stocks
Download: Stock Return Value Estimator
Check out this offer while you wait!