

When calibrating accurate quantitative data for chemical concentrations, you sometimes run into the problem of your best-fit line curving off with more extreme data points, rending it useless, or almost useless. This is where the Calibration Cubic Template can come in handy to resolve this common issue. In this instance, you simply can’t use a linear curve to get your data. You have to take a different approach and in most cases, you can simply use a quadratic or cubic best-fit line instead. If ignored, the result could break up your concentrations into two separate regions instead. To download and use this free template, just follow the guided instructions below.
Using the Calibration Cubic Template
Start by following the link at the bottom of the page to download the free Calibration Cubic Template.
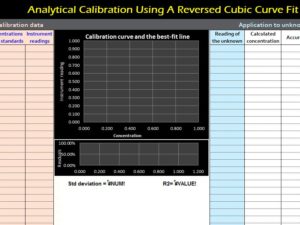
You will begin by entering the standard concentrations the instrument readings in the first two columns, highlighted in orange. You will then list the corresponding readings for your unknown data in the blue column.
You will then list the readings for the unknowns and the corresponding uncertainties if those are known. You’ll receive a list of calculated concentrations in column L, along with the percentage of accuracy for the reading and the margin of error.
For an even better example of your data, the chart at the center of the template will display the calculated curvature of your concentrations, using a cubic formula to create one solid plot that doesn’t disperse your data.
This template is a simple and fast way to calculate your concentrations with more extreme data points that go outside the bounds of the others. Using a cubic formula to arrive at your answer is a great way to make sure your data fits nicely into this best-fit curve.
Download: Calibration Cubic Template
Check out this offer while you wait!