

A Cause and Effect Diagram Template is used to identify, sort and display conceivable causes of a precise issue or characteristic. Since it is easier to use a visual figure, an illustration of a Cause and Effect Diagram Template is a simpler method of illustrating the association between a given result and all the factors that influence that result.
Completing a Cause and Effect Diagram Template can assist in identifying the potential source, the reactions for a specific effect, or problem. You can sort out some of the connections among the factors affecting a specific process or effect. Analyzing existing problems can also be discovered so that action can be taken.
Using the Cause and Effect Diagram Template
The diagram is a tool that assists in determining the root cause(s) of an issue using a structured approach, which, as mentioned earlier, is a much more organized method of solving a dispute. It boosts group involvement in problem resolution and it is an easy-to-read format. A Cause and Effect Diagram Template specifies possible causes and variations of a process and benefits everyone involved by helping them understand more about the factors at hand and how they relate to one another. Moreover, areas are identified where data should be collected for additional study.
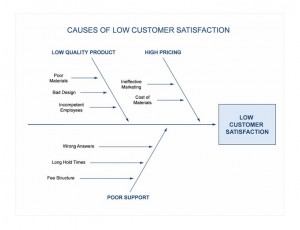
When completing a Cause and Effect Diagram Template, a structured, pictorial display of a list of causes is organized to demonstration their relationship to a specific effect. There is always a “Cause” and Effect” side. The first step is to identify and outline the outcome (effect) to be studied. Define the issue in a way that is clear to all participants. Utilizing negative effects should be avoided as the discussion can be sidetracked, placing blame on others. Positive “Effects” focus on a desired outcome and encourages pride and may lead to an optimistic environment that inspires the group to participate in the analysis.
Next, fill in the “Effect” box and draw an arrow toward the “Cause”. Then, identify the main categories. For each branch, identify multiple factors which may be the “Cause” of the “Effect”. The more detailed levels of “Causes” will require them to be organized under related the “Causes” category. “Why” questions can be very helpful in this step. Finally, analyze the diagram. If a clear answer is not identified, more details may need to be considered.
Download: Cause and Effect Diagram
Check out this offer while you wait!