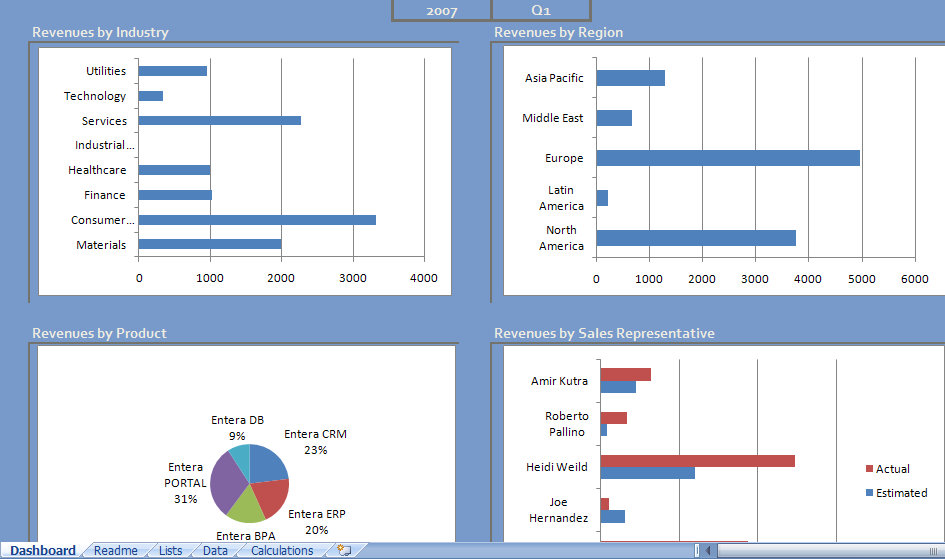
Running a sales business can be very difficult. There is personnel to track, markets to investigate and most difficult of all, finances to manage. One aspect of your business’s finances that you have to manage with great care is the revenue that your business makes. In order to maximize your revenue, you have to understand where it is coming from, which products are selling and who is making the most sales. One tool that can help you do all those things is the Sales Excel Dashboard.
How to Use the Sales Excel Dashboard
The first step is to download the free and easy-to-use Sales Excel Dashboard from this website. To view it, open it using Microsoft Excel.
Upon opening the dashboard, you will need to input the name of your company in place of the default name. After doing that, go to the “List” tab at the bottom of the spreadsheet. Here, you will add all the years, quarters, regions, industries, products and sales representatives that you will want represented on your dashboard. Lastly, go to the “Data” tab and input all the sales information for your company.
Once all the data is input, you can look at your dashboard to see a summary of revenue by industry, product, region and sales representative. Change the year and quarter by selecting them from the drop down lists at the top of the main dashboard page. Furthermore, you can look at the “Calculations” tab for more detailed information on each quarter’s sales.
Tips on Using the Sales Excel Dashboard
- Click on the “Readme” tab in order to view more detailed instructions on how to use the Sales Excel Dashboard. By following these instructions, you can even upload your dashboard to the internet and access it anywhere. This makes it even easier to use or share your dashboard.
- While entering information on the “Data” tab, you only need to manually enter the name of the customer, the estimated revenue and the actual revenue. All the other information can be selected via drop-down box. Doing this will speed up your data input.
Managing revenue is an important task for any business. Understanding the origins of that revenue with the Sales Excel Dashboard will make it easier to manage your business and attain success.

Download: Sales Excel Dashboard
Check out this offer while you wait!


How do i run this dashboard from excel, which file should i open from Excel.
Kindly help
Check your email. I sent a zipped copy of this excel template.
Hi
Can you send me some Dashboards
Here are the dashboards on my site: Excel Sample Dashboards